Signal Processing & Spectral Analysis (scipy.signal & scipy.fft)
Sensor streams, mechanical vibrations, electrical telemetry, and acoustic signals are time-series waveforms. SciPy provides fast Fourier transforms and digital filter design routines.
1. Fast Fourier Transform (scipy.fft)
The Discrete Fourier Transform (DFT) decomposes a signal into constituent sinusoids. For real-valued time series, always use scipy.fft.rfft (Real FFT), which omits redundant negative frequencies.
Amplitude Recovery & Frequency Bins
For a tone , the true peak amplitude is recovered via:
Example
Output:
2. Spectral Leakage & Window Functions
When a tone does not fit an integer number of cycles within the sample record, energy leaks into neighboring frequency bins (spectral leakage). Multiplying by a window function (Hann, Hamming, Flat-Top) forces the signal smoothly to zero at both ends:
# A plotting script for generating the windowing comparison figure
import numpy as np
import matplotlib.pyplot as plt
from scipy import fft
from scipy.signal import get_window

fs, N = 1000.0, 1000
t = np.arange(N) / fs
# 50.5 Hz tone (non-integer cycles over 1 second)
x = 3.0 * np.cos(2 * np.pi * 50.5 * t)

plt.figure(figsize=(8, 4))
for w_name, col in [('boxcar', 'k--'), ('hann', 'b-'), ('flattop', 'r-')]:
    w = get_window(w_name, N)
    X = fft.rfft(x * w)
    amp = 2.0 * np.abs(X) / w.sum()
    freqs = fft.rfftfreq(N, 1 / fs)
    plt.plot(freqs[:150], 20 * np.log10(amp[:150] + 1e-12), col, label=w_name)

plt.ylim(-80, 15)
plt.title("Spectral Leakage: Boxcar vs Hann vs Flat-Top")
plt.xlabel("Frequency (Hz)")
plt.ylabel("Magnitude (dB)")
plt.legend()
plt.tight_layout()
plt.savefig('public/modules/scipy/ch07_windowing.png', dpi=300)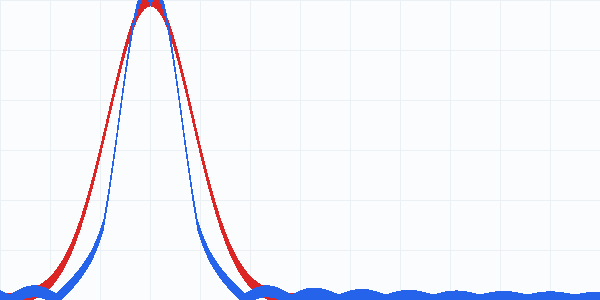
Figure 7.1: Windowing attenuates sidelobe leakage at the expense of mainlobe width.
3. Power Spectral Density via Welch’s Method (welch)
A single raw periodogram of noise has 100% relative error that does not diminish by taking longer records. Welch’s method averages overlapping windowed periodograms, reducing variance:
Example
Output:
4. Digital Filter Design: Always Use output='sos'
When designing IIR digital filters (Butterworth, Chebyshev, Elliptic), high-order filters parameterized by transfer-function polynomials b, a suffer catastrophic polynomial-root sensitivity.
Always specify output='sos' (Second-Order Sections) and use signal.sosfilt or signal.sosfiltfilt. Never use b, a for filters of order greater than 3.
Designing and Verifying a Butterworth Low-Pass Filter
Example
Output:
5. Peak Finding on Sensor Streams (find_peaks)
scipy.signal.find_peaks identifies local maxima. Use prominence rather than absolute height to prevent drifting baselines from corrupting detection:
Example
Output:
6. Try It Yourself
Problem: Clean a Signal with Zero-Phase Filtering
Design a 2nd-order Butterworth low-pass filter with cutoff at in 'sos' format. Test its frequency response gain at and .
Show solution
import numpy as np
from scipy import signal

fs = 500.0
sos = signal.butter(2, 40.0, btype='low', fs=fs, output='sos')
_, h = signal.sosfreqz(sos, worN=[10.0, 150.0], fs=fs)
gains = 20 * np.log10(np.abs(h))

print(f"Gain at 10 Hz : {gains[0]:.2f} dB")
print(f"Gain at 150 Hz: {gains[1]:.2f} dB")